A strategy map is primarily an illustrated view of how an organization's strategy is interconnected and dependent upon certain key objectives. The concept that contributed to the invention of strategy maps is that you cannot measure what you cannot describe. Therefore, a strategy map should help you understand and communicate the business processes that you are responsible for monitoring.
Strategy maps can resemble the following in a dashboard:
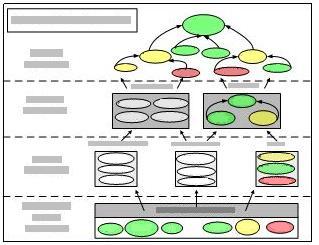
Strategy map reports let you see the relationships and dependencies that exist among business metrics such as "Total backorders," "Contribution margin," and "Increase revenue." They can also illustrate how those same metrics affect the overall objective of, for example, "Increase Profitability."
In Dashboard Designer, strategy maps are created by using Microsoft Office Visio 2007. Each of the Visio shapes in the strategy map represents information collected from your organization's key performance indicators (KPIs). As the status of these KPIs changes, the color of the Visio shape also changes. Therefore, it is easy to see where fluctuations are occurring.
To use a strategy map report
-
Click any hyperlink embedded in the strategy map report.
-
If the Visio diagram was not saved as static, additional interactivity is available through Visio Viewer. Online Help for Visio Viewer functions is available in the Visio Viewer user interface.