This documentation is updated on a regular basis. To obtain the most current version, go to PerformancePoint Server on Microsoft Office Online (http://go.microsoft.com/fwlink/?LinkID=96771).
A trend analysis chart report is created in Dashboard Designer to track historical trends as measured by the key performance indicators (KPIs) of scorecards.
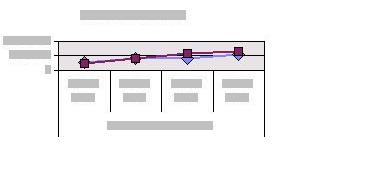
Trend analysis charts can resemble the following in a dashboard:
These charts can be helpful in understanding, for example, where progress is being made and where more attention must be focused. They may also be useful in predicting future activity.
To make a trend analysis chart interactive
-
If the trend analysis chart was not saved as static, interactivity is available through Office 2003 Web Components.
-
Use the Office Web Components toolbar to change the presentation and data details of this chart.