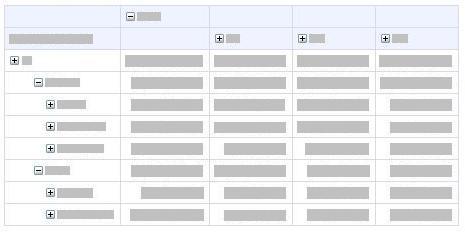
Analytic grids are dynamic, visual representations of performance data displayed as tables. These interactive reports give you an easy way to view and explore data that is stored in SQL Server 2005 Analysis Services. Because these reports are available in your Web browser, you do not have to install additional software to use them. In addition, these reports remain connected to the data. This means their content is always up to date.
Analytic grids can resemble the following in a dashboard:

Analytic grids pull information from data that has been arranged into cubes in Analysis Services 2005. These cubes consist of dimensions, which are structured, hierarchical ways of organizing information. For example, a Products dimension might have hierarchies such as Products > Product Categories > Product Names. A Date dimension might have hierarchies such as Year > Week > Day. This method of arranging data lends itself to ad-hoc analysis and data exploration.
Depending on how an analytic grid is set up (typically done by an Analyst or IT Administrator), you can use the analytic grid to:
-
Explore the data by drilling down (or up) to see lower (or higher) levels of detail.
-
Sort the rows based on a column in the grid and filter out empty rows or columns.
-
Pivot the report.
-
Isolate one item or remove an item from the report view.
-
Change the grid to a chart.
-
Use Additional Actions (provided any are defined in the cube).
-
Show or hide information, such as measures or background information for the report.
-
Work with pages of report data (for large query results).
In This Section
Sort data and filter empty rows or columns
Isolate or remove items in the grid
Use Additional Actions in the grid
Change the report type and format